Why Are Bond Yields Still Volatile Despite RBI’s Liquidity Push?
If the RBI has been injecting liquidity into the financial system, why are bond yields still moving unpredictably?
The answer is straightforward: RBI liquidity actions influence the debt market, but they are not the only force driving yields. Government borrowing, currency risk, inflation expectations, global oil prices, foreign capital movement, and market sentiment continue shaping the direction of India’s bond market.
For investors searching for terms like RBI liquidity impact on Indian debt market 2026, understanding this relationship matters because it directly affects:
Bond fund performance
Government securities (G-Secs)
Corporate bond returns
Fixed income portfolio strategy
HNI wealth allocation decisions
In 2026, the RBI has been balancing:
Approximately ₹30 trillion debt supply pressure
State borrowing requirements
Banking system deposit gaps
Rupee defense measures
Foreign exchange outflows
Geopolitical and Middle East risks
RBI Liquidity Actions and Their Impact
RBI Tool
Effect on Bonds
2026 Example
Open Market Operations (OMO)
Adds liquidity and generally reduces yields
₹2.15L Cr liquidity plan
Forex Swaps
Adds rupee liquidity
$10B USD-INR swap (Feb 4, 2026)
CRR Reduction
Frees banking liquidity
Banking liquidity support
Liquidity Drain
Removes excess cash and can raise yields
Inflation control measures
Definition: RBI liquidity actions are central bank measures used to inject or absorb money from the financial system to influence borrowing costs and market liquidity.
RBI’s Liquidity Toolkit: How the Central Bank Influences Bond Yields
Why Are Yields Still Volatile Despite RBI Support?
Liquidity injections usually soften yields, but they cannot eliminate volatility.
The 10-year G-Sec yield remained around 7.03–7.05% during mid-May 2026, showing that markets continue reacting to broader risks.
Key factors include:
Large government borrowing programs
Rising crude oil prices
Middle East geopolitical uncertainty
Significant deprecitation of Indian rupee agains USD
Foreign capital outflows
Inflation expectations
This reinforces an important takeaway: RBI liquidity actions influence the Indian debt market, but they do not completely override supply and macroeconomic forces.
Portfolio Implications for Retail and HNI Investors
Opportunities
1. Short-duration debt strategies
Current conditions may favor:
Short-term debt funds
Banking and PSU funds
High-quality corporate debt
Target maturity funds
2. Improved sentiment environment
Cooling inflation alongside liquidity support may improve:
Fixed income demand
Portfolio stability
Income opportunities
3. Attractive HNI positioning opportunities
Investors can consider:
Bond ladder strategies
Diversified debt allocation
Duration balancing
Risks Investors Should Monitor
Large debt supply
Global volatility
Inflation surprises
Liquidity withdrawal risks
FAQ
How do RBI OMOs affect my bond fund?
OMOs generally support bond prices and may benefit debt fund valuations.
Why do bond yields fall after liquidity injections?
Additional liquidity increases bond demand, which raises prices and lowers yields.
Are short-duration funds attractive in 2026?
They may offer lower interest-rate sensitivity during periods of uncertainty.
How do forex swaps affect debt markets?
Forex swaps inject rupee liquidity into the financial system and ease funding conditions.
What is the outlook for Indian bond markets in 2026?
Liquidity support remains positive, but borrowing pressures and global risks could keep volatility elevated.
Why Many Investors Are Moving Beyond Fixed Deposits
Imagine this.
You have ₹10 lakh parked in fixed deposits earning 6-6.5% annually. It feels safe. But with inflation hovering around 4-5%, your real return barely grows your wealth.
Now consider this: Government securities in India are currently yielding around 6.8-7.2%. High-quality corporate bonds can offer 7.5-8.5%, and select structured bonds may offer even more.
So the real question becomes:
Why rely on just one fixed income instrument when a simple diversification strategy could increase yields while maintaining safety?
Many retail and HNI investors assume that diversifying bonds requires complex strategies or institutional expertise. With a few practical steps, investors can build a stable, diversified fixed-income portfolio that balances safety, liquidity, and yield.
Why Diversification Matters in Fixed Income Investing
Most investors diversify equities but forget that fixed income also carries risks.
Holding only one type of instrument like FDs or a single corporate bond, exposes investors to unnecessary concentration risk.
A diversified fixed income portfolio helps:
Improve yield potential
Reduce credit risk
Manage interest rate fluctuations
Maintain liquidity
Generate predictable income
For example, instead of putting ₹10 lakh entirely in one FD, an investor could spread investments across government securities, corporate bonds, SDLs, and inflation-protected instruments.
This approach increases stability while improving returns.
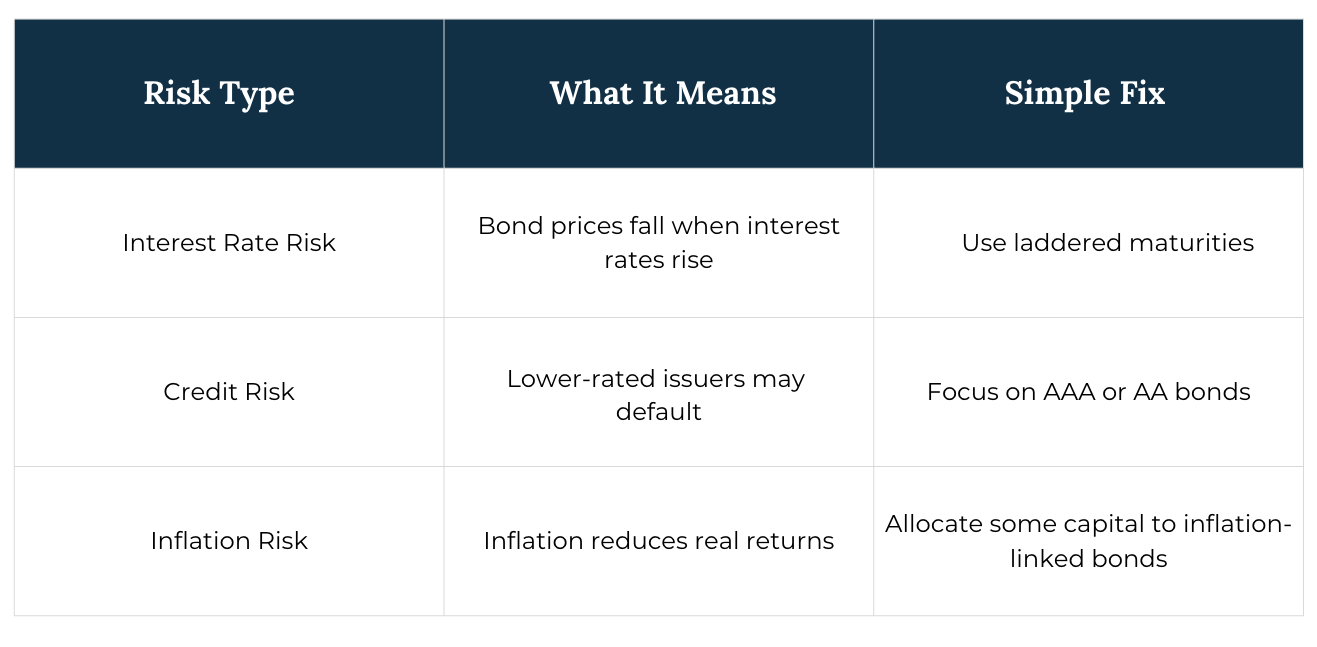
Key Risks in Fixed Income Investing (And How to Manage Them)
Even safe investments carry risks. The goal is risk management through diversification.
A balanced portfolio reduces the impact of these risks.
Simple Strategies to Diversify Fixed Income Investments
Investors do not need complicated financial engineering to diversify bonds. A few proven strategies work well.
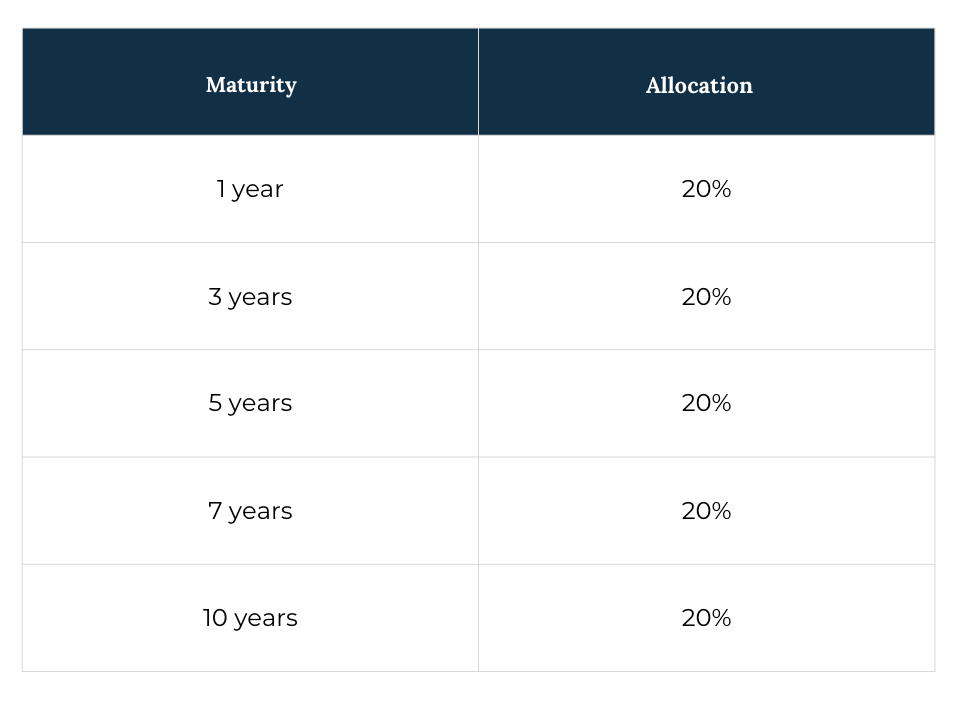
1. Bond Laddering (Best for Stability)
Bond laddering means buying bonds with staggered maturities.
Example allocation:
Benefits:
Provides regular liquidity
Reduces interest rate risk
Allows reinvestment when rates change
Investors can easily build ladders using Government Securities (G-Secs) through the RBI Retail Direct platform.
2. Barbell Strategy (Balancing Yield & Liquidity)
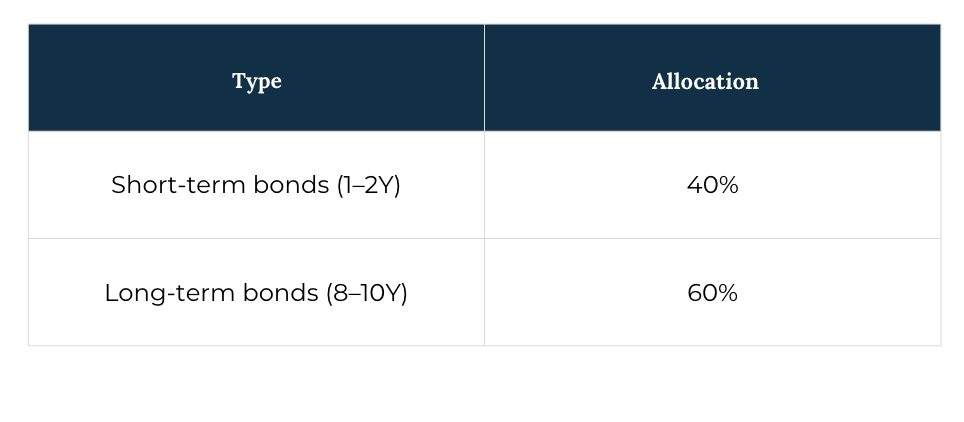
Another simple approach is the barbell strategy, where investors combine:
Short-term bonds (for liquidity)
Long-term bonds (for higher yield)
Example:
This approach balances cash flow stability with higher returns.
3. Mix Different Fixed Income Instruments
Instead of relying on one type of bond, investors should diversify across instruments.
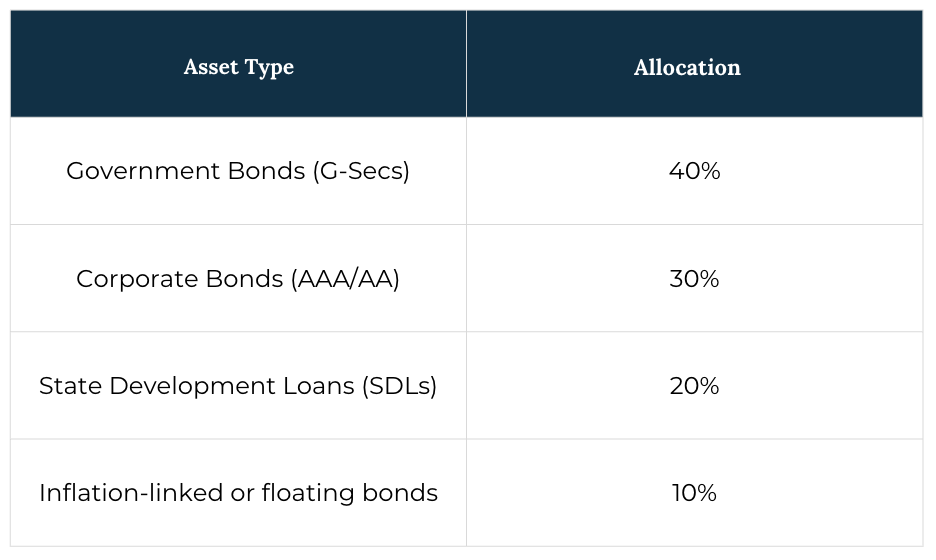
Example portfolio structure:
This mix combines sovereign safety with yield enhancement.
Fixed Income Opportunities in 2026
The Indian fixed income market currently offers interesting opportunities.
1. Stable RBI Interest Rate Outlook
The RBI has maintained a neutral stance on rates, while inflation has gradually moderated. This environment supports stable bond yields.
2. Attractive State Development Loans (SDLs)
SDLs often provide 30–60 basis points higher yield than G-Secs with relatively low risk.
3. Growth of Green Bonds
India’s sustainable finance market is expanding, and green bonds issued by government-backed institutions are becoming attractive for long-term investors.
4. Tax Efficiency
Long-term bond investments may benefit from favorable tax treatment depending on holding structure and investment vehicle.
Investors should evaluate tax implications carefully when structuring fixed income portfolios.
Platforms Where You Can Buy Bonds in India
Today, investing in bonds is far easier than it used to be.
Retail investors can access diversified fixed-income investments through platforms such as:
RBI Retail Direct
Allows investors to buy government securities directly from RBI auctions.
NSE goBID
Enables participation in government bond auctions via stock exchanges.
Online Bond Platforms
There are multiple Online bond Pplatforms which such as GoldenPi allow investors to explore corporate bonds and structured fixed-income products.
Investment Apps
Debt mutual funds and bond ETFs are also accessible through apps like Groww or Zerodha.
Typical process:
Open an account on a platform
Browse available bonds
Evaluate yield and credit rating
Build a diversified basket
Minimum investment for many bonds starts from ₹10,000.
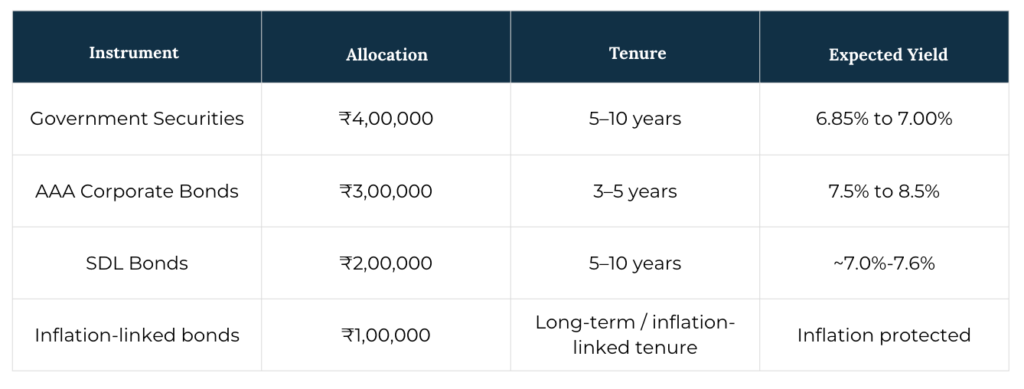
Example Fixed Income Portfolio (₹10 Lakh)
Here is a simple diversified allocation for an investor seeking stability and yield.
Expected portfolio yield: 7.5-8% with moderate risk
Compared to traditional FDs, this strategy could add 1-2% additional yield annually.
Frequently Asked Questions
What is the minimum investment required for bonds in India?
Many bonds are available from ₹10,000 onwards, though some corporate bonds may require higher minimums.
How often should a fixed income portfolio be rebalanced?
A yearly review is sufficient for most investors.
Are debt mutual funds better than direct bonds?
Debt funds are suitable for investors seeking professional management and diversification, while direct bonds provide greater control over yields and maturities.
Are corporate bonds safe?
High-quality AAA and AA-rated bonds from strong issuers generally offer a good balance of safety and yield.
Final Thoughts
Fixed income investing does not have to be complicated.
By combining government bonds, corporate bonds, SDLs, and inflation-linked instruments, investors can build a diversified portfolio that delivers:
Stable income
Higher yield than traditional FDs
Lower risk through diversification
For both retail and HNI investors, the key is to keep the strategy simple, disciplined, and diversified.
Even starting with ₹1 lakh can help investors begin building a well-balanced fixed income portfolio.
In today’s interconnected financial world, the impact of central bank announcements are much faster than it was earlier due to technological advancements, no longer just technical policy updates. Their statements, meeting minutes, and press releases conferences play a major role in shaping bond markets around the world. Understanding these signals is not only important for large institutional investors but also for. It has become increasingly relevant for everyday investors as well.
If you invest in debt mutual funds, government bonds, fixed deposits linked to market rates, or other fixed-income instruments, central bank decisions can directly influence the returns and risks of your investments.
Simply put, learning how to interpret central bank signals is becoming an essential skill for anyone investing in fixed income.
This guide breaks down everything you need to know: which announcements of central banks matter most, what signals they send, how those signals move bond yields, what current conditions indicate, and most importantly how you can position your fixed-income portfolio intelligently.
1. Understanding Central Bank Signals in Fixed Income Markets
At its core, the price of a bond is determined by interest rates. When rates rise, existing bond prices fall. When rates fall, bond prices rise. This inverse relationship is fundamental to fixed-income investing. But what causes interest rates to move? In large part, it is the decisions and the anticipated decisions of central banks.
Central banks do not simply change rates overnight. They communicate well in advance through a range of signals: policy statements, forward guidance, voting records, dot plots, and governor speeches. Experienced investors parse every word of these communications because the market often moves on what is expected, not what has already happened.
Why This Matters for Retail Investors
If you hold a long-duration debt mutual fund and the RBI or Fed signals a prolonged rate hike cycle, your NAV could erode significantly before a single rate hike is officially announced. Understanding the signals lets you act before the market has fully priced them in.
For retail investors, the importance is threefold:
Return implications: Bond prices and yields move in anticipation of central bank action, not just after it.
Risk management: Knowing where rates are headed helps you manage duration risk and the sensitivity of your portfolio to rate changes.
Opportunity recognition: Rate cycles create predictable windows of opportunity in specific bond categories.
2. The Major Central Banks Driving Global Bond Markets
Not all central banks carry equal weight. While every country has its own monetary authority, a handful of institutions drive global capital flows and set the tone for bond markets worldwide.
The Fed is the most influential central bank in the world. Its decisions on the federal funds rate ripple through every major bond market. When the Fed raises rates, capital tends to flow towards U.S. Treasuries, causing yields in emerging markets (including India) to rise as well, as investors demand higher returns to compensate for the outflow risk. The Fed’s FOMC meets eight times a year, and its dot plot, a chart showing individual members’ rate expectations, is one of the most closely watched documents in global finance.
The ECB governs monetary policy for the 20-nation Eurozone. Its decisions directly affect European sovereign bond markets – German Bunds, French OATs, Italian BTPs and influence dollar-euro dynamics that affect cross-border bond flows globally. ECB President press conferences and the quarterly Staff Economic Projections are critical signal sources.
The Bank of England (BoE)
The UK Monetary Policy Committee meets roughly every six weeks and publishes detailed minutes and quarterly Monetary Policy Reports. Given the UK’s close financial ties with both Europe and emerging markets, BoE signals have a meaningful secondary effect on global risk appetite.
The Reserve Bank of India (RBI)
For Indian retail investors, the RBI is the central bank that matters most directly. The Monetary Policy Committee (MPC) meets six times a year and sets the repo rate – the key rate that influences everything from government bond yields to corporate fixed deposits. RBI Governor speeches, liquidity management operations, and the bi-monthly policy statement are all critical signal sources that retail investors should follow closely.
The Bank of Japan (BoJ)
Japan’s ultra-loose monetary policy for decades made it a major exporter of global capital through the so-called ‘carry trade.’ As the BoJ shifts away from Yield Curve Control (YCC), it is becoming an increasingly important signal source – any tightening from Tokyo sends ripples through Asian bond markets and global risk sentiment.
The People’s Bank of China (PBoC)
China’s role in global bond markets has grown substantially. The PBoC’s management of lending rates (LPR), reserve requirements, and currency policy has a direct bearing on Asian credit markets and commodity-linked economies, including India.
3. The Key Signals Investors Should Watch
Central banks communicate through multiple channels. Learning to read each one gives you a significant informational edge.
Policy Rate Decisions
The headline number, whether rates are hiked, cut, or held is the most obvious signal. But the magnitude matters too. A 25bps hike signals measured tightening; a 50bps or 75bps hike signals urgency and can cause sharp bond sell-offs.
Forward Guidance
Forward guidance is the explicit communication of where central banks expect rates to go. Phrases like ‘higher for longer,’ ‘data-dependent,’ or ‘accommodative stance’ carry enormous weight. When the Fed shifted from ‘transitory inflation’ language to signalling sustained rate hikes in 2022, long-duration bond portfolios suffered dramatic losses within months.
Dot Plots and Rate Projections (Fed-Specific)
The Fed’s dot plot shows each committee member’s anonymous projection for where the federal funds rate will be at year-end and over the next several years. A shift in the median dot upward is a hawkish signal; downward movement is dovish. Retail investors should review the dot plot after every FOMC meeting.
Hawkish vs. Dovish Language
Hawkish signals indicate a bias towards tighter monetary policy (higher rates). Dovish signals indicate a bias towards easier monetary policy (lower rates). Watch for language changes between consecutive meetings even removing a single phrase like ‘ongoing rate increases’ can be a significant dovish pivot.
Inflation and GDP Projections
When central banks revise their inflation forecasts upward, it signals that rates may need to stay elevated longer. When growth forecasts are cut, it often signals that rate cuts are approaching to stimulate the economy. Both scenarios have direct consequences for bond pricing.
Voting Records and Dissents
MPC and FOMC voting records reveal internal disagreement. A committee that was previously unanimous for hikes but shows one or two dissenting votes signals that the end of the tightening cycle may be near. This is one of the most underappreciated signals available to retail investors.
Balance Sheet Actions (QE / QT)
Quantitative Easing (QE) involves a central bank buying bonds, injecting liquidity and pushing yields down. Quantitative Tightening (QT) does the opposite, selling bonds or allowing them to mature, withdrawing liquidity and pushing yields up. These balance sheet decisions are as important as rate decisions for long-duration bond investors.
4. How Central Bank Signals Move Bond Yields
Understanding the transmission mechanism and how signals translate into yield movements is critical.
Short-End vs. Long-End Dynamics
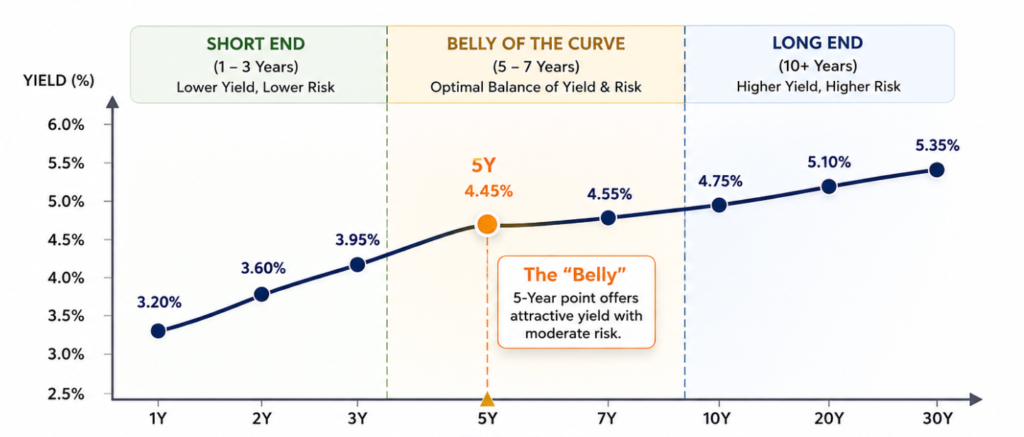
Short-duration bonds (1-3 year) are most directly affected by current and near-term policy rate expectations. Long-duration bonds (10-30 year) are more sensitive to inflation expectations, growth outlook, and long-term rate projections. This is why the yield curve – a plot of yields across maturities is such a valuable diagnostic tool.
The Yield Curve as a Signal
A normal (upward-sloping) yield curve reflects healthy growth expectations. An inverted yield curve (short-term rates above long-term rates) has historically been one of the most reliable recession indicators. A flat curve often signals a transition period. Monitoring yield curve shape helps retail investors anticipate economic and rate cycle shifts before they are officially announced.
Duration Risk: The Most Misunderstood Concept
Duration measures a bond’s sensitivity to interest rate changes. A bond with a duration of 7 years will lose approximately 7% in price for every 1% rise in yields. Many retail investors in long-duration debt funds do not appreciate this risk until they experience it firsthand. In a rising rate environment, short-duration bonds significantly outperform long-duration ones.
Duration Risk Example
If you hold a debt mutual fund with an average duration of 8 years and yields rise by 100bps (1%), your fund NAV could decline by approximately 8%. This is why understanding central bank signals and positioning your duration accordingly is not optional for serious fixed-income investors.
Credit Spreads and Liquidity
Beyond government bonds, central bank signals affect corporate bond spreads as well. Hawkish signals tighten liquidity, widen credit spreads, and increase borrowing costs for corporates making corporate bonds riskier. Dovish signals compress spreads, improving returns on credit instruments.
5. What Current Global Signals Are Indicating
As of early 2026, major central banks have paused rate adjustments after prior cuts, balancing resilient growth (India GDP projected at 7.4%) with persistent inflation risks and global uncertainties. Retail investors should monitor upcoming MPC/FOMC meetings closely, as language shifts could signal restarts to easing or tightening.
The U.S. Federal Reserve
The Federal Reserve kept the federal funds rate unchanged at 3.5%-3.75% in March 2026, marking the second consecutive pause. The Fed’s projections currently indicate only one rate cut, as the labor market remains strong and services inflation is still elevated.
The Reserve Bank of India
The RBI has kept the repo rate steady at 5.25% since December 2025, with the neutral policy stance confirmed in the February 2026 MPC meeting. Although inflation has eased to 3.21% (February CPI YoY), the 10-year G-Sec yield has risen to around 7.0%, largely due to oil price shocks and higher state government borrowing.
The ECB and Bank of England
Both central banks are currently holding rates steady. The Bank of England maintained the Bank Rate at 3.75% on March 19, 2026, with a unanimous vote, as policymakers remain cautious due to persistent energy-related inflation. The ECB is also maintaining a cautious stance, balancing inflation concerns with slower economic growth.
The Bank of Japan: The Outlier
The Bank of Japan is gradually raising rates toward its 2% inflation target, reaffirmed in March 2026. These policy moves are also contributing to the unwinding of yen carry trades, which is adding some volatility to global markets.
6. Impact on Fixed Income Markets
Central bank signal divergence has created a complex but opportunity-rich environment across fixed income sub-segments.
Government Bonds: Easing cycles in India and the West are supportive of sovereign bond valuations. Indian G-Secs are particularly attractive given current yield levels relative to anticipated rate cuts.
Corporate Bonds and Credit: As liquidity conditions improve, investment-grade corporate spreads tend to compress, offering alpha over government bonds for investors willing to take measured credit risk.
Floating Rate Instruments: In environments of rate uncertainty, floating rate bonds and funds offer a hedge against unexpected tightening.
Emerging Market (EM) Debt: A dovish Fed typically weakens the dollar, providing support to EM currencies and making EM debt more attractive to global investors.
Short-Duration Instruments: Liquid funds, ultra-short bond funds, and short-term FDs continue to offer attractive real returns in the current environment, with minimal duration risk.
7. Opportunities Emerging in Fixed Income
The current pause in interest rates (as of April 2026) is creating selective opportunities for retail investors in fixed income. With India’s 10-year G-Sec yield around 7.0%, investors can benefit from relatively high yields, but should remain mindful of inflation risks and fiscal pressures. The focus should be on high-quality instruments and moderate duration, rather than assuming immediate rate cuts.
Locking in Elevated Yields
Interest rates remain higher than historical averages, with the RBI repo rate at 5.25% and the 10-year G-Sec yield around 7.0%. This provides attractive income potential for investors. Extending duration moderately into 3-7 year government bond funds can offer a balanced risk-return profile, but only if the investment horizon matches, especially as inflation remains in the 3-5% range.
Indian Government Securities (G-Secs)
India’s inclusion in the JP Morgan GBI-EM index continues to attract foreign investor inflows, estimated at $20–25 billion cumulatively by early 2026. This has helped support bond demand even as oil price shocks recently pushed yields up by around 30 basis points. For retail investors, gilt funds or target maturity funds are practical ways to access G-Secs. The current 10-year yield of about 7.0% remains attractive if global liquidity conditions remain supportive.
Target Maturity Funds
Target maturity funds offer a simple and structured way to invest in bonds. They provide predictable maturity timelines, tax efficiency, and potential market gains. If interest rates decline after the current pause, investors could benefit from regular accrual income along with potential capital gains of around 2-4% from falling yields. These funds are generally suitable for investment horizons of 3-7 years.
High-Quality Corporate Bonds
High-quality AAA and AA-rated corporate bonds currently offer yields about 50–100 basis points higher than government bonds, translating to yields of roughly 7.5–8.0%. These bonds carry relatively low credit risk. If liquidity conditions improve, spreads could narrow by 20–30 basis points, which may support better returns. Investors should continue prioritizing investment-grade issuers, particularly given ongoing global uncertainties.
Quick Reference: Central Bank Signals & Bond Market Reactions
Central Bank Signal
Bond Market Reaction
What Retail Investors Should Do
Rate hike cycle signalled (Hawkish)
Yields rise (7%+ India 10Y); prices fall
Reduce duration; shift to short FDs/liquid funds
Rate cut pivot (Dovish)
Yields fall; prices rise
Extend to 3-7Y G-Secs; lock in 7%+ yields opportunistically
Pause / hold stance
Yields stabilize (7%); curve flattens
Hold medium-duration; monitor CPI (3-5%)
Quantitative Tightening (QT)
Long-end yields up; liquidity tight
Avoid long-duration; watch AA/AAA spreads
Liquidity injection / QE
Yields compressed; credit spreads tighten
Favor credit bonds, EM debt (e.g., Indian G-Secs)
8. Risks Investors Should Watch
No investment opportunity comes without risk. Retail investors must remain vigilant about the following:
Inflation re-acceleration: A surprise resurgence in inflation could halt or reverse rate cut cycles, causing bond prices to fall unexpectedly. Monitor monthly CPI and WPI data closely.
Global risk-off events: Geopolitical tensions, banking sector stress, or sharp currency depreciation can trigger risk-off sentiment, causing credit spreads to widen sharply.
Duration miscalculation: Entering long-duration bonds prematurely before the rate cut cycle is clearly established carries meaningful price risk if cuts are delayed.
Currency risk for global bond exposure: Investing in foreign currency bonds without hedging exposes retail investors to exchange rate risk that can outweigh yield advantages.
Liquidity risk in lower-rated credit: Chasing higher yields in lower-rated corporate bonds or NCDs can result in liquidity problems if credit conditions deteriorate. Stick to investment-grade instruments.
Overreliance on historical patterns: Rate cycles do not always play out as historically observed. Central bank forward guidance can and does change as data evolves.
9. How Retail Investors Should Position Their Fixed-Income Portfolio
Portfolio positioning should reflect your investment horizon, risk tolerance, and a clear-eyed view of where the rate cycle stands. Here is a framework for the current environment:
If you have a short-term horizon (< 1 year)
Prioritise capital preservation and liquidity. Liquid funds, overnight funds, and short-term bank FDs are appropriate. Avoid duration risk entirely.
If you have a medium-term horizon (1–3 years)
Consider short to medium-duration debt funds, floating rate funds, or target maturity funds maturing within your investment window. This allows you to benefit from accrual income and modest capital appreciation if rates ease.
If you have a long-term horizon (3+ years)
This is where the current rate environment offers the most compelling opportunity. Long-duration gilt funds, dynamic bond funds managed by experienced fund managers, and direct G-Sec investments via the RBI Retail Direct platform can deliver meaningful total returns as the rate cycle eases.
Golden Rule Never allocate more to long-duration bonds than you can afford to hold through a full rate cycle. Bond prices can be volatile in the short term even when the long-term direction is favourable. Discipline and patience are as important as analytical rigour.
10. Final Insight: Why Central Bank Communication Is the New Market Driver
There was a time when central banks operated in deliberate opacity intentionally keeping markets guessing to maintain policy flexibility. Today, central bank communication is itself a primary monetary policy tool. The Federal Reserve’s introduction of forward guidance, the RBI’s detailed MPC minutes, and the ECB’s regular press conferences are all designed to manage market expectations proactively.
What this means for retail investors is profound: the game is no longer just about reacting to rate changes. It is about reading signals accurately, acting ahead of consensus, and understanding the narrative that central banks are trying to construct. Institutional investors employ entire research teams to do exactly this. Retail investors who educate themselves on reading central bank communication and who partner with advisors who specialise in fixed income can access the same edge.
In today’s environment of heightened market volatility, uncertain inflation dynamics, and geopolitical uncertainty, central bank communication has become a key driver of financial markets. For investors, overlooking these signals is not simply passive, it can significantly increase portfolio risk.
Most investors who lost money in IL&FS bonds in 2018 didn’t take excessive risk, they took on risks they didn’t understand. The bonds carried AA/AAA ratings from CRISIL/ICRA. IL&FS seemed like a quasi-government powerhouse. Yields of 8-8.5% beat G-Secs at 7.5%.
None of that mattered when ₹90,000cr hidden debt triggered defaults and **70-90% principal haircuts**. Fixed income isn’t inherently safe. It’s predictable when you know what to evaluate.
In March 2026, Brent crude breached $115, the INR breached ₹94/$, and the 10Y G-Sec breached 6.927%. The risk landscape for Indian bond investors has never been more complex.
This guide gives you the exact framework to evaluate every major fixed income risk.
1. Interest Rate Risk: The Risk That Moves Your Portfolio Without Warning
When the RBI changes the repo rate, your bond portfolio reacts immediately even if you haven’t touched it.
Here’s the mechanism: bond prices move inversely to interest rates. When rates rise, existing bond prices fall. When rates fall, existing bond prices rise. This is not optional, it is mathematical.
The Tool You Need: Macaulay Duration
Macaulay Duration tells you how sensitive a bond is to interest rate changes.
A simple rule: If a bond has a 7-year duration, its price can fall by about 7% if interest rates rise by 1% (100 bps).
Example
A 10-year Government Security (G-Sec) with about 7-year duration could lose around 7% of its value if the RBI increases interest rates by 1%.
If you hold the bond until maturity, this price change usually doesn’t matter; you’ll still receive the promised interest and principal.
But if you need to sell the bond before maturity, the price drop could lead to a loss.
In short: The longer the duration, the higher will be the riskiness of price movement for the bonds more a bond’s price can move when interest rates change. What to do in the current environment:
RBI cut repo rate by 125 bps across 4 Monetary Policy Meetingsactions in 2025 (now paused at 5.25%) and most market participants believe the cutting cycle is over. With oil-driven inflation resurfacing and global yields rising, the risk of a rate hike is not zero.In this situation, bonds with 3–5 year maturity can be a balanced option. They typically offer better returns than short-term instruments, while avoiding the higher interest-rate risk that comes with long-term bonds.
In simple terms: 3–5 year bonds can provide a good balance between yield and risk in the current market.
For HNIs: If you’re holding long-duration bonds (10Y+) for income, model the mark-to-market impact of a 50 bps rate hike. Know the number before it happens.
For retail investors: If you’re buying bonds via NSE goBID or BondScanners, Aalways try to check the duration alongside the yield. A 9% yield with 12-year duration is a very different risk than a 9% yield with 3-year duration.
2. Credit Risk : The One That Keeps Bond Managers Awake at Night
Credit risk is the probability that the bond issuer cannot pay you back either the coupon, the principal, or both.
The rating framework in India:
While there are multiple credit rating agencies in India, CRISIL, ICRA, and CARE are in the top India’s three major rating agencies. Their scales run from AAA (lowest risk) down to D (default). The spread between ratings tells you how much extra yield the market is demanding for the extra risk:
Rating
Typical yield (March, 2026)
Who Issues
AAA PSU
7.20 – 7.25%
NHAI, REC, PFC
AAA Private
7.55 – 7.75%
Top-tier corporates
AA PSU
8.25 – 8.45%
Mid-tier PSUs
AA Private
8.50 – 9.25%
NBFCs, private cos
The rule of thumb: demand at least 100–150 bps spread over the 10Y G-Sec for AA-rated corporate bonds. If India’s 10-year G-Sec yield is 6.73%, an AA-rated NCD offering around 8% is considered reasonable.
But if a bond offers 14%, it usually means the risk is much higher, and investors should be cautious.
The IL&FS and DHFL lesson – still relevant:
Both were AA-rated before they defaulted. IL&FS was government-linked. DHFL was a household brand. The ratings lagged reality by months.
Beyond ratings, check:
Debt-to-equity ratio: under 1x is healthy for most non-financial corporates
Interest coverage ratio: the issuer should earn at least 3x what it pays in interest
Rating trajectory: has it been upgraded or downgraded recently? A stable AA is very different from an AA that was recently AA+
For HNIs: Read the offer document. Check if the bond is secured (backed by specific assets) or unsecured. In liquidation, secured creditors are paid first. Yes Bank’s AT1 bonds were written to zero in March 2020 because they were structured as the most subordinated layer; most buyers didn’t understand that until it was too late.
For retail investors: Stick to AAA and AA+ rated bonds unless you’re consciously accepting the higher risk for higher yield. Do not let a 12–14% yield override common sense.
3. Liquidity Risk : Can You Actually Exit When You Need To?
This is the most underestimated risk in India’s fixed income market.
G-Secs and T-Bills trade daily on NDS-OM and through RBI’s Retail Direct platform. Because they are actively traded, the difference between buying and selling prices is very small (about 2–5 basis points).
NCDs and lower-rated corporate bonds are different. They are not traded as frequently as government bonds. Because of this, the difference between buying and selling prices can be much larger (around 120–2550 basis points).
The test before you buy:
Check the daily trading volume on NSE/BSE for the specific bond. If it trades less than ₹1 crore daily on average, it may be difficult to sell quickly. This may not matter if you plan to hold the bond until maturity.But it can become a problem if you need to sell the bond before maturity.
For HNIs: Large investments in illiquid bonds increase both concentration risk and liquidity risk. For example, selling a ₹5 crore position in a thinly traded NCD can be much harder than selling the same amount in government bonds (G-Secs).
For retail investors: Government bonds bought through platforms like NSE goBID or the RBI Retail Direct portal offer sovereign safety and good liquidity, making them a simpler and safer option for most fixed income investors.
4. Inflation Risk: The Silent Return Killer
A bond yielding 7% sounds attractive. Against 5.5–6% CPI inflation, your real return is less than 1.5%.
This is not a theoretical concern. India’s CPI has averaged around 5-6% over the past several years. Oil above $100 creates imported inflation pressure. The rupee at ₹94/$ makes imports more expensive. Real returns can compress quickly. Because of this, your actual purchasing power from bond returns can fall.
Shorter-duration bonds – you can reinvest sooner if interest rates rise.
AAA corporate bonds at 7.5%+ – meaningfully above inflation with acceptable risk
Inflation-indexed government bonds also exist in India, but they are issued rarely and are not traded much, so they are not very practical for most investors.
5. Reinvestment Risk : What Happens When the Money Comes Back
When a bond matures or pays a coupon, you need to reinvest. In a falling rate environment, you’ll reinvest at lower rates compressing your effective return over time.
This is why locking in longer-duration bonds when rates are high is strategically valuable. If you believe the RBI’s rate-cutting cycle will resume, buying 10Y corporate bonds at 8%+ today means you’ve secured that yield for a decade regardless of what rates do next.
Bond laddering :
Instead of putting everything into one tenure, spread maturities across 2Y, 5Y, 7Y, and 10Y instruments. As each bond matures, you reinvest the money at the current market interest rates. This strategy helps reduce reinvestment risk over time.
A practical HNI allocation framework for 2026:
A diversified fixed income portfolio could look like this:
40% in G-Secs and SDLs for stability
30% in AAA PSU bonds for slightly higher yield with low risk
20% in AA corporate bonds selected carefully
10% in NCDs for higher yield (with thorough credit checks)
A good rule is to limit exposure to any single issuer to 10% of the fixed income portfolio to reduce concentration risk.
6. Tax Risk: The Return You Actually Keep
This is the most overlooked risk among both retail and HNI investors.
How bond income is taxed in India:
Coupon income (interest) from bonds is taxed at your income tax slab rate. For HNIs if you are in the 30% tax bracket, a bond yielding 9% will give you about 6.3% return after tax.
Capital gains tax on bonds:
Held under 12 months: taxed at slab rate (Short Term Capital Gains)
Held over 12 months: taxed at 12.5% (Long Term Capital Gains, no indexation)
Tax-efficient fixed income options worth knowing:
Tax-free bonds (NHAI, REC, PFC) The interest from these bonds is completely tax-free. For someone in the 30% tax bracket, a 5.5% tax-free return is roughly equal to about 7.9% pre-tax yield from a taxable bond.
54EC bonds (NHAI, REC) If you sell a property, you can invest the capital gains in these bonds within 6 months and save long-term capital gains tax up to ₹50 lakh. These bonds have a 5-year lock-in and offer a coupon of around 5.25%.
Note: Budget 2025 removed indexation benefit for bond LTCG
Always calculate post-tax yield before comparing instruments. A 9% NCD vs a 6% tax-free bond may look like a 3% difference, but after 30% tax, the gap is actually closer to 0.7%.
7. Call and Structural Risk: Read the Fine Print
Some bonds give the issuer the right to repay early called “callable bonds”. If rates fall and the issuer can borrow more cheaply, they will call the bond and you’ll be left reinvesting at lower rates.
The number to check: Look at Yield to Call (YTC), not just Yield to Maturity (YTM).
For example: If a bond shows 9% YTM but only 7.5% YTC, and the bond is likely to be called, your actual return may be closer to 7.5%.
Higher Risk Example: AT1 Bonds
Some bank bonds called AT1 (Additional Tier 1) bonds carry even higher risk.
These bonds:
Have no fixed maturity (perpetual)
The interest payment can be skipped if the bank’s financial position weakens
The principal can even be written down to zero under regulatory rules
This risk became clear when Yes Bank AT1 bondholders lost their investment in March 2020.
Because of these risks, AT1 bonds are suitable only for investors who can handle the possibility of losing the entire investment.
The Pre-Investment Checklist : 6 Questions to Ask Every Time
Before committing to any fixed income instrument:
1. What is the credit rating and has it changed recently? A recent downgrade is a warning signal not a buying opportunity.
2. What is the spread over the 10Y G-Sec? India’s 10Y is at 6.96%. Demand at least 100 bps above this India’s 10 year benchmark G-sec (currently 6.48% GS 2035) for AA-rated paper. If the spread is too high, ask why.
3. What is the duration and how does a 1% rate rise affect my position? Multiply duration by 1% to get the approximate price fall. Know this number.
4. What is the daily trading volume? Under ₹1 crore/day on NSE/BSE = illiquid. Plan accordingly.
5. What is my post-tax return? For the 30% bracket: multiply yield by 0.70. Compare that to tax-free alternatives.
6. How much of my portfolio is in this single issuer? Cap at 10%. No exceptions, regardless of how confident you feel.
Where to Monitor in Real Time
RBI / CCIL: Daily G-Sec yield curve, the most authoritative source for G-Sec yields in India
NSE / BSE secondary market: Bond trading volumes and live prices
CRISIL / ICRA websites: Rating actions and outlooks
Risk in fixed income is not one thing. It is six or seven things happening simultaneously and in a market shaped by Middle East oil shocks, a weakening rupee, and a RBI that has paused its rate cycle, all of them are live right now.
The investors who navigate this environment well are not the ones who avoid risk. They are the ones who understand exactly which risks they are taking, price them correctly, and size their positions accordingly.
Global debt market entered a phase of heightened volatility in March 2026, driven by geopolitical tensions, rising crude oil prices, and shifting interest rate expectations. The ongoing conflict involving the United States, Israel, and Iran hadhas pushed crude oil prices above $115 per barrel and still remains elevated, creating renewed inflation concerns across global economies. As energy costs rise and markets anticipate potential policy responses from central banks, bond yields have started to move higher across major economies.
For investors, particularly high-net-worth individuals looking for stable income opportunities, understanding how these macroeconomic developments influence debt markets is crucial.
Geopolitical tensions in the Middle East, particularly disrupting the Strait of Hormuz, are driving crude oil prices sharply higher, alongside currency depreciation, trade imbalances, and transportation cost surges. These interconnected pressures amplify inflation for import-heavy economies like India and contribute to rising global bond yields.
Oil and Inflation Drivers
Middle East conflicts have caused major supply disruptions, with over 50% of India’s crude imports transiting the Hormuz Strait, pushing prices toward $100+/bbl and fueling costs in manufacturing, aviation (ATF up 35-40% of expenses), and trucking.icajobguarantee+2
Currency Weakness
The INR has weakened to near 91-92/USD due to higher oil bills and foreign outflows, with RBI interventions capping further slides amid $3B+ equity exits.moneycontrol+2
Trade and Import Strain
India’s current account deficit widened to $13.2B (1.3% GDP) in Q4 from elevated oil imports ($12-15B extra per $10/bbl rise) and slower exports, compounded by LPG shortages prompting US sourcing.ainvest+2
Transportation Escalation
Freight and diesel costs have surged war-risk insurance up 400%, diesel at ₹90-97/L affecting 65-70% of trucking with supply chain delays from rerouting.economictimes+1
Bond Yield Impact
Rising inflation expectations from these factors lead bond investors to demand higher yields, evident in recent global upticks including India’s G-Secs.tradingeconomics
Rising Global Bond Yields
The impact of these macroeconomic pressures is visible in government bond markets across the world.
The U.S. 10-year Treasury yield currently stands between 4.2% – 4.3%, up from approximately 4.05% earlier in the week as investors reassess the likelihood of future interest rate adjustments. Shorter-term yields have also remained elevated, with the U.S. 3-year Treasury yield hovering around 3.75% – 3.80%, reflecting persistent inflation concerns.
In India, the benchmark 10-year government bond yield is currently ranging between 6.65% – 6.75%. While this level remains relatively stable compared to recent months, it reflects cautious investor sentiment as markets evaluate global inflation risks, currency movements, and government borrowing needs.
For fixed-income investors, these yield levels remain attractive compared to many developed market alternatives especially in corporate bonds and SDLs.
Corporate Credit Markets Remain Stable
Despite the volatility in government bond markets, corporate credit markets have remained relatively resilient.
In the United States, the BBB corporate option-adjusted spread is currently around 1.06%, significantly below its long-term average of approximately 1.90%. Tight spreads indicate that investors continue to perceive corporate credit risk as manageable despite higher interest rate levels.
Emerging Market Debt Outlook
Emerging market debt continues to attract attention from investors seeking higher yields. Many emerging economies have already implemented significant monetary tightening in previous years, and some are now seeing inflation trends stabilize.
India’s debt market remains particularly attractive within the emerging market universe. 10 year Government bond yields near 6.7%, combined with relatively stable macroeconomic fundamentals and fiscal consolidation efforts, have supported continued investor interest.
However, volatility remains a key risk factor. Oil price shocks, currency fluctuations, and geopolitical developments could continue to influence capital flows and bond market sentiment in the near term.
What This Means for High-Net-Worth Investors
In the current environment, fixed-income investments are once again becoming an important component of portfolio strategy for high-net-worth investors.
Elevated bond yields amid geopolitical tensions create timely opportunities for stable income generation, helping investors balance equity market volatility through diversified fixed-income portfolios.
Current Corporate Bond Yields
High-quality corporate bonds offer attractive rates across ratings, with AAA secured bonds at 7.20 – 7.25% for PSUs and 7.55 – 7.74% for private issuers, providing reliable income with low default risk. AA-rated secured bonds yield 8.25-8.45% (PSU) and 10.50 -11% (private), rewarding slightly higher risk with enhanced returns suitable for diversified strategies. Sub-debt options further boost yields: AAA at 7.38 – 7.45% (PSU) and 7.95 – 8.06% (private), AA+ at 7.70 – 7.75% (PSU) and 8.70 – 9.15% (private).
Building Income Portfolios
Government securities form the core for stability, complemented by these corporate bonds based on risk tolerance AAA for preservation, AA/AA+ for yield enhancement. Structured credit can add further diversification, blending these instruments to capture elevated yields while mitigating volatility.
At the same time, investors should remain mindful of macroeconomic developments such as oil price movements, currency fluctuations, and central bank policy decisions, which can influence interest rates and bond market performance.
Strategic allocation across different segments of the fixed-income market can help investors manage risk while capturing attractive yield opportunities.
Looking Ahead
Debt markets in 2026 are being shaped by a complex mix of geopolitical tensions, inflation risks, and evolving monetary policy expectations. While these factors may create short-term volatility, they are also contributing to a more attractive yield environment for fixed-income investors.
For high-net-worth individuals seeking stability and predictable income, the current market conditions may present an opportunity to reassess fixed-income allocations and lock in favorable yields across select debt instruments.
Global bond markets often serve as a key indicator of investor sentiment. When demand for Investment-Grade Bonds rises, it typically reflects how investors are positioning themselves in response to macroeconomic uncertainty, interest rate expectations, and geopolitical developments.
Recent activity in global credit markets suggests that investors are increasingly allocating capital toward high-quality fixed-income assets , even as global economic conditions remain uncertain. Strong issuance volumes, tight credit spreads, and steady inflows into investment-grade debt point to a market environment where investors are balancing the pursuit of yield with a growing focus on stability.
Record Bond Issuance Signals Strong Investor Demand
One of the clearest indicators of investor demand in fixed-income markets is the pace of bond issuance.
Bond issuance kicked off 2026 with impressive speed, as issuers raced to capitalize on eager buyers. Global sales topped $1 trillion by February, one of the strongest starts on record, driven by corporations and governments locking in favorable terms.
In the US, high-grade corporate issuers raised nearly $88 billion in peak weeks, while Europe saw €57 billion ($66.5 billion) issued in a single day. This supply absorption shows investors’ hunger for stable income streams amid volatile equities and economic crosswinds. For context, Morgan Stanley projects total US investment-grade gross issuance could reach a record $2.25 trillion for full-year 2026.
Tight Credit Spreads Reflect Investor Confidence in Corporate Credit
Another important signal of strong demand for investment-grade credit is the behavior of credit spreads, the extra yield investors require above government bonds to hold corporate debt.
The U.S. BBB corporate option-adjusted spread (OAS) currently stands around 1.06%, significantly below its long-term average of roughly 1.90%. Tight spreads indicate that investors are demanding relatively small risk premiums for holding corporate credit, suggesting confidence in the creditworthiness of issuers. You can track live OAS data via the FRED BBB OAS series maintained by the St. Louis Fed.
At the same time, US Treasury yields remain near 4.2%, providing investors with attractive baseline yields. This environment makes investment-grade corporate bonds appealing because they offer a modest yield premium over government securities while maintaining relatively low default risk. In fact, Bloomberg reported that US high-grade spreads briefly touched their lowest level since 1998 in January 2026.
Despite the high level of issuance in global markets, credit spreads have remained historically tight, highlighting the depth of investor demand for investment-grade credit assets.
While investment-grade bonds dominate global demand, investors are also exploring opportunities in markets offering higher yields.
Emerging markets such as India have attracted growing interest from global investors due to relatively attractive sovereign yields. India’s 10-year government bond yield of around 6.7% provides a notable premium over many developed-market government bonds.
This pattern suggests that investors are not fully retreating from risk. Instead, they are selectively allocating capital, balancing higher-yield opportunities in emerging markets with exposure to stable investment-grade assets.
A Signal of Selective Risk Appetite
Taken together, these trends offer insight into the current state of global risk appetite.
Strong demand for investment-grade bonds suggests that investors are positioning more defensively amid persistent macroeconomic uncertainty. Concerns about inflation, geopolitical tensions, fiscal expansion, and shifting central bank policies are encouraging many investors to prioritize stability and predictable income.
However, tight credit spreads and record issuance volumes also indicate that investors remain willing to allocate capital to corporate credit markets. Rather than signaling a full “risk-off” environment, the bond market currently reflects selective risk-taking within higher-quality assets.
The Broader Market Implications
Bond markets often provide early signals about broader financial market trends. Strong demand for investment-grade credit suggests that investors are preparing for an environment where economic growth remains uncertain and volatility persists.
In such conditions, investment-grade bonds offer several advantages: diversification, stable income, and relatively low credit risk. As a result, they continue to play a central role in institutional portfolios.
For market participants, monitoring demand for investment-grade bonds can provide valuable insights into how investors are adjusting their portfolios in response to evolving global economic conditions.
Conclusion
The strong demand for investment-grade bonds in 2026 reflects a global investment environment shaped by both opportunity and caution.
Record issuance, tight credit spreads, and steady investor inflows all point to a market where investors continue to seek yield, stability, and diversification. While risk appetite has not disappeared, it has become more selective, with investors favoring assets that combine reliable income with strong credit quality.
As global markets navigate inflation pressures, geopolitical tensions, and shifting monetary policies, investment-grade bonds are likely to remain a key anchor for investors seeking resilience in an uncertain environment.
Investors in India often evaluate fixed-income investments by looking at one number, the interest rate. Whether it’s a corporate bond offering 8.25%, a bank FD at 7.5%, or a debt mutual fund delivering 7% annualised returns, the instinct is simple: higher is better.
But yield alone is not a sufficient decision-making metric.
The right fixed-income investment is determined by risk structure, liquidity, taxation, and interest-rate sensitivity, not just return.
This guide provides a structured framework tailored to Indian markets, enabling investors to compare fixed-income options beyond headline returns.
Where Do We Stand? Indian Rate & Inflation Context
Any fixed-income comparison in India must begin with macro context.
The benchmark 10-year Government of India (G-Sec) yield is typically tracked via securities issued by the Reserve Bank of India.
Policy rates are determined by the Monetary Policy Committee (MPC) of the RBI.
Debt mutual funds are taxed at slab rate (no long-term capital gains indexation benefit for newer investments).
Bank FD interest is taxed at slab rate.
Capital gains on listed bonds may differ based on holding period.
An 8% FD for someone in the 30% tax bracket effectively becomes ~5.6% post-tax.
Always compare post-tax yield, not headline yield.
Inflation: Calculate Real Return
If CPI inflation runs at 5% and your bond yields 7%, your real return is only 2%.
Inflation erodes purchasing power over time.
For long-term investors:
Consider instruments aligned with inflation expectations.
Avoid locking into low real yields for extended periods.
Real return analysis separates disciplined investors from yield chasers.
Reinvestment Risk
In India, when rates fall:
Maturing FDs may have to be reinvested at lower rates.
Coupon payments from bonds earn lower reinvestment returns.
Long-term bonds reduce reinvestment risk but increase duration risk.
There is always a trade-off.
Match Investment With Objective
Different investors require different structures.
For Capital Protection
Short-term G-Secs
Treasury Bills
Overnight/low-duration funds
For Stable Income
AAA PSU bonds
Banking & PSU debt funds
Target maturity funds
For Tactical Rate Play
Long-duration G-Sec funds
Dynamic bond funds
Return comparison without goal alignment leads to poor allocation.
Professional Fixed-Income Comparison Checklist (India)
Before choosing an instrument, ask:
What is the benchmark G-Sec yield?
What is expected total return over my holding period?
What is duration?
What is credit rating and spread?
What is liquidity profile?
What is post-tax return?
What is real return after inflation?
Does this align with my objective?
If two instruments offer similar yields, the one with:
Better credit quality
Lower duration (if rate risk is high)
Higher liquidity
Better tax efficiency
…is usually the superior choice.
Final Thoughts
India’s fixed-income landscape has evolved significantly from simple bank FDs to dynamic debt funds and target maturity ETFs.
But one principle remains constant:
Higher yield always comes with higher risk whether that risk is credit, duration, liquidity, or tax inefficiency.
Sophisticated investors do not chase returns; they evaluate risk-adjusted efficiency.
By applying a structured framework benchmark context, duration, credit risk, liquidity, taxation, inflation, and objective alignment investors can make informed decisions that preserve capital and optimise income across market cycles.
You scroll your portfolio and wonder: why are so many big bond managers buying shorter-dated, high-yielding instruments rather than piling into long-dated Treasuries? The short answer: with yields already attractive and central-bank path uncertain, investors are prioritising carry (income) and credit selection over duration bets that could blow up if inflation surprises or rate cuts stall.
This post explains with up-to-date market evidence and practical portfolio guidance why global bond investors are favouring yield over duration in 2026, what risks they’re accepting, and how investors (retail and institutional) should think about the trade-off.
Imagine two friends Ravi (conservative saver) and Meera (the finance-savvy cousin). Ravi locks a pile of cash in a 10-year thinking longer is safer. Meera splits across short corporate paper and selective high-quality long credit; she earns steady coupons while avoiding big mark-to-market swings when rates wobble. In 2026, professionals are choosing Meera’s path more often not because duration is irrelevant, but because income today matters more than speculative duration gains in a world of sticky inflation and uncertain policy moves.
1) The market context: yields are attractive but rates are fragile
Two quick facts that set the scene:
The U.S. 10-year Treasury yield settled near ~4.08% in mid-February 2026 lower than the highs of the prior year but still materially above the ultra-low levels of earlier cycles. (Trading Economics)
Global inflation is trending down from post-pandemic peaks but remains uneven; the IMF and major strategists continue to flag inflation and policy uncertainty as key risks into 2026. (IMF)
What this means: yields provide attractive carry compared with recent years, but central bank paths (and inflation surprises) could move yields quickly. That combination pushes investors toward harvesting yield while limiting exposure to long-duration volatility.
2) Why yield (carry) looks better than a duration bet right now
Here are the core reasons institutions are tilting to yield:
Carry is immediate, duration is prospective. Coupons are cash today. Duration gains only materialise if yields move in the investor’s favour, a bet that requires correct timing and large conviction.
Central-bank uncertainty. Markets remain unsure whether policy is truly done with rate cuts of if hikes or if cuts will follow; this ambiguity makes long-duration bets risky. Several bond strategists advise selectivity rather than blanket duration exposure. (Bloomberg.com)
Tighter spreads vs default expectations. For many credit sectors, spreads are relatively tight, but short-duration, higher-coupon high-yield or short-dated corporate paper can still offer attractive carry with limited duration. Asset managers highlight high income + short duration as a preferred income strategy. (Allianz Global Investors)
Liquidity and repricing risks. Long-duration positions become vulnerable when liquidity dries up or inflation surprises hit investors prefer to be paid now for risk rather than chase potential price appreciation.
Macro and fiscal quirks in EM/India. Local markets (like India) show yield volatility tied to supply and fiscal operations encouraging a focus on yield capture and shorter maturities for many active managers. (Reuters)
3) Evidence from asset managers and market flows
Major house views in late-2025/early-2026 illustrate the rotation:
Global managers (Schroders, Allianz, Aberdeen and others) emphasise active management, income generation, and selective credit exposure often recommending shorter duration plus careful sector selection rather than blanket long-duration exposure. (Schroders)
Bloomberg and trade newsletters report investors are “settling for” carry in some pockets accepting that total returns will be driven by coupons and spread management rather than big price moves on duration. (Bloomberg.com)
These are not temporary fads, they’re tactical shifts driven by today’s risk/reward.
4) The risk trade-offs, what investors are giving up and gaining
When you prioritise yield over duration you typically:
Gain:
Predictable cash income (coupons) that compounds or funds spending
Lower sensitivity to sudden rate moves if you shorten duration
Flexibility to reinvest at potentially better levels if rates fall later
Give up:
Upside from major price gains if yields collapse (long-duration winners)
Potentially lower long-run total return if duration rally materialises
Convexity advantages that come with high-duration Treasury positions
Bottom line: yield-focused strategies trade some upside for steadier cash flows and lower near-term price volatility.
5) How bond investors are implementing the “yield-first” playbook
Here are common tactical approaches professionals use:
Short-duration, high-carry credit -short-dated High Yielding or BB/BBB issues where carry outweighs modest spread risk. (Managers expect defaults manageable vs carry.) (Allianz Global Investors)
Steepener or curve-tilt trades – pick maturities with better risk/reward rather than naïvely buying more than 320-yr duration.
Barbell with income focus- combine money-market/short-term paper + select long credit positions for asymmetric payoff.
Active credit selection – reduce passive duration risk and instead chase idiosyncratic carry opportunities where compensation appears fair. (Schroders)
Local-currency EM and IG carry – selectively using emerging-market sovereign and corporate yields where fundamentals permit (but watch FX).
6) Practical checklist for advisers & retail investors
If you’re thinking of tilting to yield, use this checklist:
Define horizon & liquidity needs. Are you income-hungry now or focused on long-term appreciation?
Check duration exposure. Shorten duration if you fear inflation surprise/policy volatility.
Assess credit quality & expected default. Carry is attractive only if default/loss expectation is lower than the coupon. (Allianz Global Investors)
Tax and currency impacts. After-tax yield or FX can materially change attractiveness (especially for cross-border EM/credit).
Stress-test scenarios. Run +100–200 bps yield shock and spread-widening scenarios to assess downside.
7) Where duration still makes sense
This is not an “either/or” world. Duration remains vital when:
You need to lock in a long-term liability match (pensions, insurance).
You have high conviction on central-bank easing and want to capture price appreciation.
You’re funding a long-term target and can stomach interim volatility.
The smart move is selective duration, not blanket avoidance.
8) What Sovereign Global recommends (practical closing)
At Sovereign Global, our view is pragmatic:
For clients needing income and capital preservation: favour shorter-duration instruments with high carry (carefully selected IG corporate paper, AAA PSU bonds, and short-duration credit funds).
For clients seeking total-return upside with risk appetite: complement income holdings with select long-duration, high-quality sovereigns or targeted long credit but size these positions conservatively.
For institutional accounts: blend laddering, active credit selection, and regular stress-testing to capture carry while managing downside.
If you want, we can run a personalised “yield vs duration” stress test on your portfolio show expected coupon income, d
Conclusion
In 2026 the bond market’s mood is pragmatic: harvest income now, manage duration risk smartly, and be selective about credit. Investors who prioritise risk-adjusted yield and flexible duration positioning are better placed to navigate policy uncertainty and capture dependable returns.
Bonds are often considered safer investments, but the way you invest in them is just as important as choosing to invest in them. A well-chosen bond market strategy can help preserve capital, generate steady income, or balance overall portfolio risk.
Different financial goals require different fixed income investment strategies. A short-term goal, for example, should not be funded the same way as long-term wealth preservation. This article helps Indian retail investors understand key bond strategies and match them with their bond investment objectives in a structured, risk-aware manner.
Understanding Bond Market Strategies
A clear fixed income strategy helps investors decide which bonds to buy, how long to hold them, and how to manage risk based on their financial goals. Unlike equities, bond investing is more about controlling risk and preserving capital than chasing high returns..
Risk Return Trade-off in Fixed Income
In bonds, higher returns usually come from taking one or more of the following risks:
Interest rate risk – Risk of bond prices falling when interest rates rise
Credit risk – Risk of issuer default or credit downgrade
Reinvestment risk – Risk of reinvesting coupon payments at lower rates
Effective debt market strategies balance these risks rather than eliminating them entirely.
Key Investment Objectives in Bond Investing
Most bond portfolios are built around one or more of the following objectives:
Capital preservation – Protecting principal value
Regular income – Generating predictable cash flows
Inflation protection – Reducing erosion of purchasing power
This strategy requires understanding yield curve strategy dynamics rather than chasing yields.
Ladder Strategy
What it is: Spreading investments across bonds with staggered maturities.
How it helps:
Reduces reinvestment risk
Provides periodic liquidity
Best for:
Income-focused investors
Retirees or near-retirement investors
Why it works: A ladder strategy in bonds balances stability and flexibility.
Credit Spread Strategy
What it is: Investing in lower-rated bonds to earn higher yields over government securities.
Potential benefit:
Higher income during stable credit cycles
Key caution:
Credit events can lead to capital loss
Best practice: Focus on diversification and credit quality rather than yield alone.
Matching Bond Strategies With Investment Goals
Investment Horizon
Primary Objective
Suitable Strategies
Short-term (1–3 yrs)
Capital preservation
Buy-and-hold, Ladder
Medium-term (3–5 yrs)
Income + stability
Duration-based, Ladder
Long-term (5+ yrs)
Portfolio balance
Yield curve, Credit spread (with caution)
This alignment ensures bond strategies support and do not derail financial goals.
Active vs Passive Bond Strategies
Passive Bond Strategy
Tracks an index or maturity profile
Lower costs
Suitable for predictable goals
Active Bond Strategy
Dynamic duration and credit management
Higher costs
Relies on fund manager expertise
When to choose what: Passive works well for stability; active can add value during volatile rate cycles if risk is managed prudently.
Common Mistakes Investors Make in Bond Strategies
Chasing high yields without assessing credit risk
Ignoring interest rate cycles
Overconcentration in a single issuer or fund type
Treating all debt funds as “risk-free”
Avoiding these mistakes is critical for long-term fixed income discipline.
How to Choose the Right Bond Strategy
Before investing, evaluate:
Time horizon: Match maturity to goal duration
Risk appetite: Understand tolerance for volatility and credit risk
Liquidity needs: Avoid locking funds needed soon
Tax considerations: Consider post-tax outcomes, not headline yields
A well-structured fixed income investment strategy evolves with life stages and market conditions.
Conclusion
Bond investing is not about finding the highest return, it is about aligning the right strategy with the right objective. Whether your goal is stability, income, or diversification, a disciplined bond market strategy can play a crucial role in long-term financial planning.
For investors, the key lies in understanding risks, staying diversified, and making informed decisions grounded in objectives rather than market noise. A goal-based approach to fixed income builds resilience into portfolios quietly and effectively.
Bond markets around the world are no longer static. After years of rate hikes and yield volatility, data from major economies shows a clear transition in investor behaviour from defensive positioning toward strategic repositioning ahead of an expected late-cycle environment.
This article highlights what has changed, how markets are responding, and why this matters for investors today.
U.S. Yield Curve: From Inversion to Flattening
For much of 2023, the U.S. Treasury yield curve, especially the 2s/10s segment was deeply inverted, signalling recession concerns. By early 2026, the yield curve has flattened rather than sharply inverted, suggesting markets are pricing a slowing of rate hikes without expecting deep contraction.
Yield curves trending less inverted a transition from defensive to more balanced positioning.
This shift matters because inversion historically preceded recessions, but flattening now suggests markets are repositioning for stability rather than fear.
ECB paused rate changes, focusing instead on inflation outcome independence.
Rather than dramatic yield moves, investors are repositioning toward quality and curve maturity allocation. This indicates that markets expect policy stability not sudden easing as growth momentum remains modest.
These spreads versus U.S. Treasuries create relative value opportunities, driving selective repositioning among global fixed income investors. This flow dynamic reinforces the shift away from strict defensive positions held at peak rate uncertainty.
Investor Behaviour: From Protection to Positioning
Across markets, investors are demonstrating three clear tendencies:
Duration Rebalancing
Rather than aggressive duration extension (betting heavily on rate cuts), markets are cautiously absorbing flattening curves especially intermediate maturities to hedge risk without overexposure.
Credit Quality Preference
Investment grade and high-quality sovereigns maintain tighter spreads compared to high yield, signalling investor preference for safety within yield seeking.
Liquidity as Priority
Liquidity buffers and execution strategies are being emphasised – a hallmark of repositioning rather than speculative positioning.
Why This Matters Now
The bond market shift has implications for multiple investor types:
Institutional investors can enhance risk premia by selectively extending duration while maintaining quality filters.
Fixed income strategists should watch curve steepness as an early indicator of market consensus.
Portfolio managers may use relative value across regions as macro cues gradually stabilise.
This transition reinforces that bond markets are pricing not just “peak rates”, but the path after peak rates where stability and selective opportunity replace hedging and fear.
For broader insights on positioning trends and rate expectations, see major fixed income outlooks like: BlackRock Fixed Income Insights
Conclusion: Markets Are Evolving, and So Must Strategy
Global bond markets are no longer dominated by rate hike fears. Instead, they are exhibiting strategic repositioning aligned with evolving expectations:
Yield curves normalising Central banks signalling stability Investors reallocating toward quality and intermediate duration
This shift challenges conventional playbooks. Investors who adapt by focusing on structural positioning not just directional calls are better placed to navigate the late rate-cycle environment.